The Plotly component
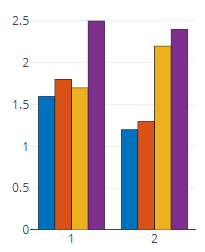
Visualize data with the Plotly component. The Plotly implementations for the Python and MATLAB versions of Simian GUI differ significantly, so they are documented in separate sections. It is possible to combine multiple types of plots in the same figure, which is demonstrated with an example.

Resizing
Please note that the Plotly component spans the entire width of its parent component, even if the plot itself is smaller.
This means that if you set layout.width and layout.height, the plot itself becomes smaller but the containing component does not, resulting in subsequent components ending up way below the plot.
In order to mitigate this, instead of setting the width and height, you can reduce the width of the component by placing it in a Columns component. The heigth can be managed using the aspectRatio property. Example:
function payload = guiInit(metaData)
    form            = Form();
    payload.form    = form;

    % Add the Plotly component to the first column of a Columns component.
    plotObj             = component.Plotly("my_plot");
    plotObj.aspectRatio = 2;
    cols                = component.Columns("plot_cols", form);
    cols.setContent({plotObj, {}}, [4, 8])
end
Background image
Images can be used as background of a Plotly component by adding the image resource, and making the axes overlap with the image.
The image must be specified by encoding the image file with the utils.encodeImage utility function. The settings below put the image in the top-right quadrant of the plot axes, with the bottom-left of the image at location (0, 0). Refer to the Plotly Image documentation for more options.
image_setup = {
    "source": encoded_image,
    "xref": "x",
    "yref": "y",
    "xanchor": "left",
    "yanchor": "bottom",
    "x": 0,
    "y": 0,
    "sizex": image_width,
    "sizey": image_height,
    "layer": "below",
}
To make the Plotly axes neatly overlay the background image, the axes ranges must match the sizes of image_setup, and the margins must be set to zero. Setting "showgrid" to false removes the grid from the plot.
margin_setup = {"l": 0, "r": 0, "t": 0, "b": 0}
xaxis_setup = {"range": [0, image_width], "showgrid": False}
yaxis_setup = {"range": [0, image_height], "scaleanchor": "x", "showgrid": False}
If you need to plot data over the background, replace the image width and height values with your data ranges. Combined with the above settings the image will be shown smaller, but without distortions in the plot axes.
In Python the Plotly API methods can be used to apply the above settings to the Figure object.
plot_obj.figure.update_layout(images=[image_setup], margin=margin_setup)
plot_obj.figure.update_xaxes(**xaxis_setup)
plot_obj.figure.update_yaxes(**yaxis_setup)
In MATLAB the above settings must be converted to a struct and put in the layout property of the utils.Plotly object that is in the component's defaultValue.
plotObj.defaultValue.layout.images = {image_struct}
plotObj.defaultValue.layout.margin = margin_struct
plotObj.defaultValue.layout.xaxis = xaxis_struct
plotObj.defaultValue.layout.yaxis = yaxis_struct
Drawing shapes
User's can draw shapes in the Plotly axes when the modeBarButtonsToAdd option of the config property is set with (a subset of) the following options: drawline, drawclosedpath, drawopenpath, drawcircle, drawrect, and eraseshape.
plot_obj.defaultValue["config"]["modeBarButtonsToAdd"] = ["drawline", ...]
plotObj.defaultValue.config.modeBarButtonsToAdd = ["drawline", ...]
Note that you can modify the look of the drawn lines by changing the layout's newshape's properties:
fillcolor: {null}, or a (named) color string.fillrule: {"evenodd" (with cut-outs)}, or "nonzero" (everything filled).opacity: {null}, or a number between zero and one. Applies to line and fill.line:color: {"black"}, or a (named) color string.dash: {"solid"}, or one of ("solid", "dot", "dash", "longdash", "dashdot", "longdashdot").width: {2}, or a number greater or equal to zero. Unit is pixels.
Get shapes in backend
The properties of the drawn shapes can be extracted in the backend by using the utils.Plotly.getShapes method. It will return a list of dicts / cell array of structs with the following contents:
Simple shapes like a "type" line, rect (rectangle), and circle contain their type, and the x and y coordinates of the bounding box of the shape:
{
    "type": "line",
    "x": [20, 30],
    "y": [15, 25]
}
A path polygon must contain the type, the coordinates of the vertices, and whether the path between the first and last point is to be closed with a line segment.
{
    "type": "path",
    "x": [20, 30, 25],
    "y": [15, 25, 30],
    "closed": true
}
When the line or fill properties are differing from the defaults, the above structures are extended with the above mentioned newshape's properties.
Add shapes in backend
With the utils.Plotly.addShape method shapes defined as one of the above structures can be added to a Plotly axes from the backend via the submission data.
The advancedPaths option (default false) allows for adding multi element and complex shapes using SVG Paths definitions.
The SVG path definition are deconstructed into separate commands and coordinates fields in the input structure to ease dynamic definition.
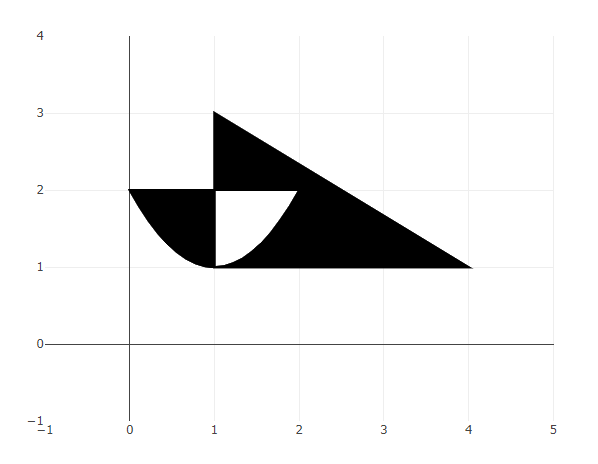
The example inputs below create one shape made up of a triangle and a parabolic segment.
The first command specifies to start at ("M") the first coordinate and draw lines ("L") to the other vertices.
The second command draws a Quadratic Bézier curve ("Q") between the start point ("M") and the end coordinate that does not have its own command (denoted with a comma). The second coordinate controls the curvature of the curve.
{
    type="path",
    command=[["M", "L", "L"], ["M", "Q", ","]],
    x=[[1, 1, 4], [0, 1, 2]],
    y=[[1, 3, 1], [2, 0, 2]],
    closed=[True, True],
}
struct( ...
    type="path", ...
    command={{{"M", "L", "L"}, {"M", "Q", ","}}}, ...
    x={{[1, 1, 4], [0, 1, 2]}}, ...
    y={{[1, 3, 1], [2, 0, 2]}}, ...
    closed=[true, true])
This multi-element shape definition (with the fillrule default being "evenodd") creates the following image with part of the triangle being cut-out by the parabola.

Remove shapes in backend
The shape objects are stored in the shapes field of the layout property. To remove shapes in the backend:
- get the Plotly data using the
getSubmissionDatautility function, - remove shape definitions from the list in the
layoutfield'sshapesfield in the returnedutils.Plotlyobject, - and send the reduced list of shapes to the browser using the
setSubmissionDatautility function.