Python
The Plotly functionality in the Python version of Simian GUI differs significantly from the MATLAB implementation as the Plotly library is directly available from Python, which can be used to visualize data in the form.
Most functionality from the Python Plotly API can be used (animations and controls are not supported) when a Plotly Figure object is put in the Plotly object's figure property.
The Plotly component creates a Plotly figure in which data can be visualized. For examples of Simian web apps with Plotly components, refer to the simian.examples.ballthrower, simian.examples.plottypes, and simian.examples.workshop_example web apps.
In addition to the properties and methods listed below, this component inherits properties and methods from the superclass Component. For example, any Plotly component has a label and hidden property even though these are not explicitly listed here.
Properties
| Name | Description | Datatype | Default |
|---|---|---|---|
| defaultValue | Dictionary with fields, "config", "data" and "layout", as described in the following rows. | Dict | |
| - config | Additional configuration of the plot such as toggling responsiveness or zooming. | Dict | {"displaylogo": False, "topojsonURL": "./assets/topojson/"} |
| - data | Data to be shown in the figure. | List | list() |
| - layout | Layout to be used in the figure | Dict | dict() |
| figure | Plotly Figure object containing the figure to be shown. | Figure | None |
| aspectRatio | Aspect ratio that the plot tries to maintain (width / height). | Number | 4 / 3 |
| tableView | When true and the component is part of an EditGrid, the component's value is shown (simplified) in the collapsed row of the EditGrid. | Boolean | False |
utils.Plotly
This utility class should be used in gui_event, not in gui_init. The utils.getSubmissionData function returns a utils.Plotly object containing the payload data for the Plotly component.
When the Plotly utils class object is put in the payload and returned to the form, the created plot is shown in the form.
utils.Plotly properties
| Name | Description | Datatype | Default |
|---|---|---|---|
| config | Additional configuration of the plot such as toggling responsiveness or zooming. | Dict | {"displaylogo": False} |
| data | Data to be shown in the figure. | List | list() |
| layout | Layout to be used in the figure | Dict | dict() |
| figure | Plotly Figure object containing the figure to be shown. | Figure | None |
Note that when putting the utils.Plotly object in the submission data, the settings in the
figureproperty may override the settings in the other properties. When thefigureproperty is set toNone, the values in the other properties are used as-is.
utils.Plotly methods
| Name | Syntax | Description |
|---|---|---|
| clearFigure | self.clearFigure(keepLayout) | Clears the figure data and most of the layout (title, axis, etc.). |
| preparePayloadValue | plot_dict = preparePayloadValue(self) | Prepares a dict representation of the figure in the Plotly component, which can be used to update the payload without directly using setSubmissionData. |
| addShape | self.addShape(data=shapes_dict, advanced_paths=bool) | Add a shape to the Plotly figure. |
| getShapes | shapes = self.getShapes(advanced_paths=bool) | Process the raw shape definitions to get x and y data in lists. |
Usage
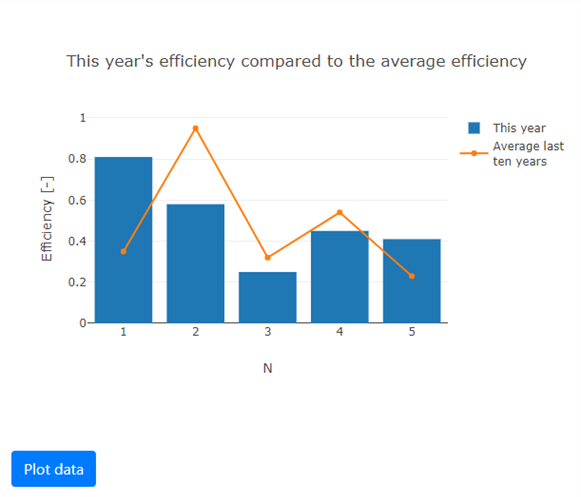
Below is an example illustrating the Python plotly functionality with an initial bar plot that is extended with an extra line when the gui_event function is executed.
Note that in Python the Plotly Express functions are available to allow for easier creation and modification of plotly figures.
import plotly.express as px
import plotly.graph_objects as go


def gui_init(meta_data):
    app_form = Form()
    plot_obj = component.Plotly("plot", app_form)
    plot_obj.figure = go.Figure(
        go.Bar(
            x=[1, 2, 3, 4, 5],
            y=[0.81, 0.58, 0.25, 0.45, 0.41],
            name="This year",
        )
    )
    plot_obj.figure.update_layout(
        title="This year's efficiency compared to the average efficiency",
        xaxis_title="N",
        yaxis_title="Efficiency [-]",
        autosize=False,
        width=600,
        height=400,
    )

    # When this button is clicked, the data is plotted.
    btn = component.Button("plot_data", app_form)
    btn.label = "Plot data"
    btn.setEvent("PlotData")

    return {"form": app_form}


def gui_event(meta_data, payload):
    plot_obj, _ = utils.getSubmissionData(payload, "plot")
    plot_obj.figure.add_scatter(
        x=[1, 2, 3, 4, 5],
        y=[0.35, 0.95, 0.32, 0.54, 0.23],
        name="Average last<br>ten years",
    )

    # Update the payload with the new values in the Plotly object.
    payload, _ = utils.setSubmissionData(payload, "plot", plot_obj)

    return payload
The form generated with the above code will look like this:
